Executive Overview
Roadmap Philosophy
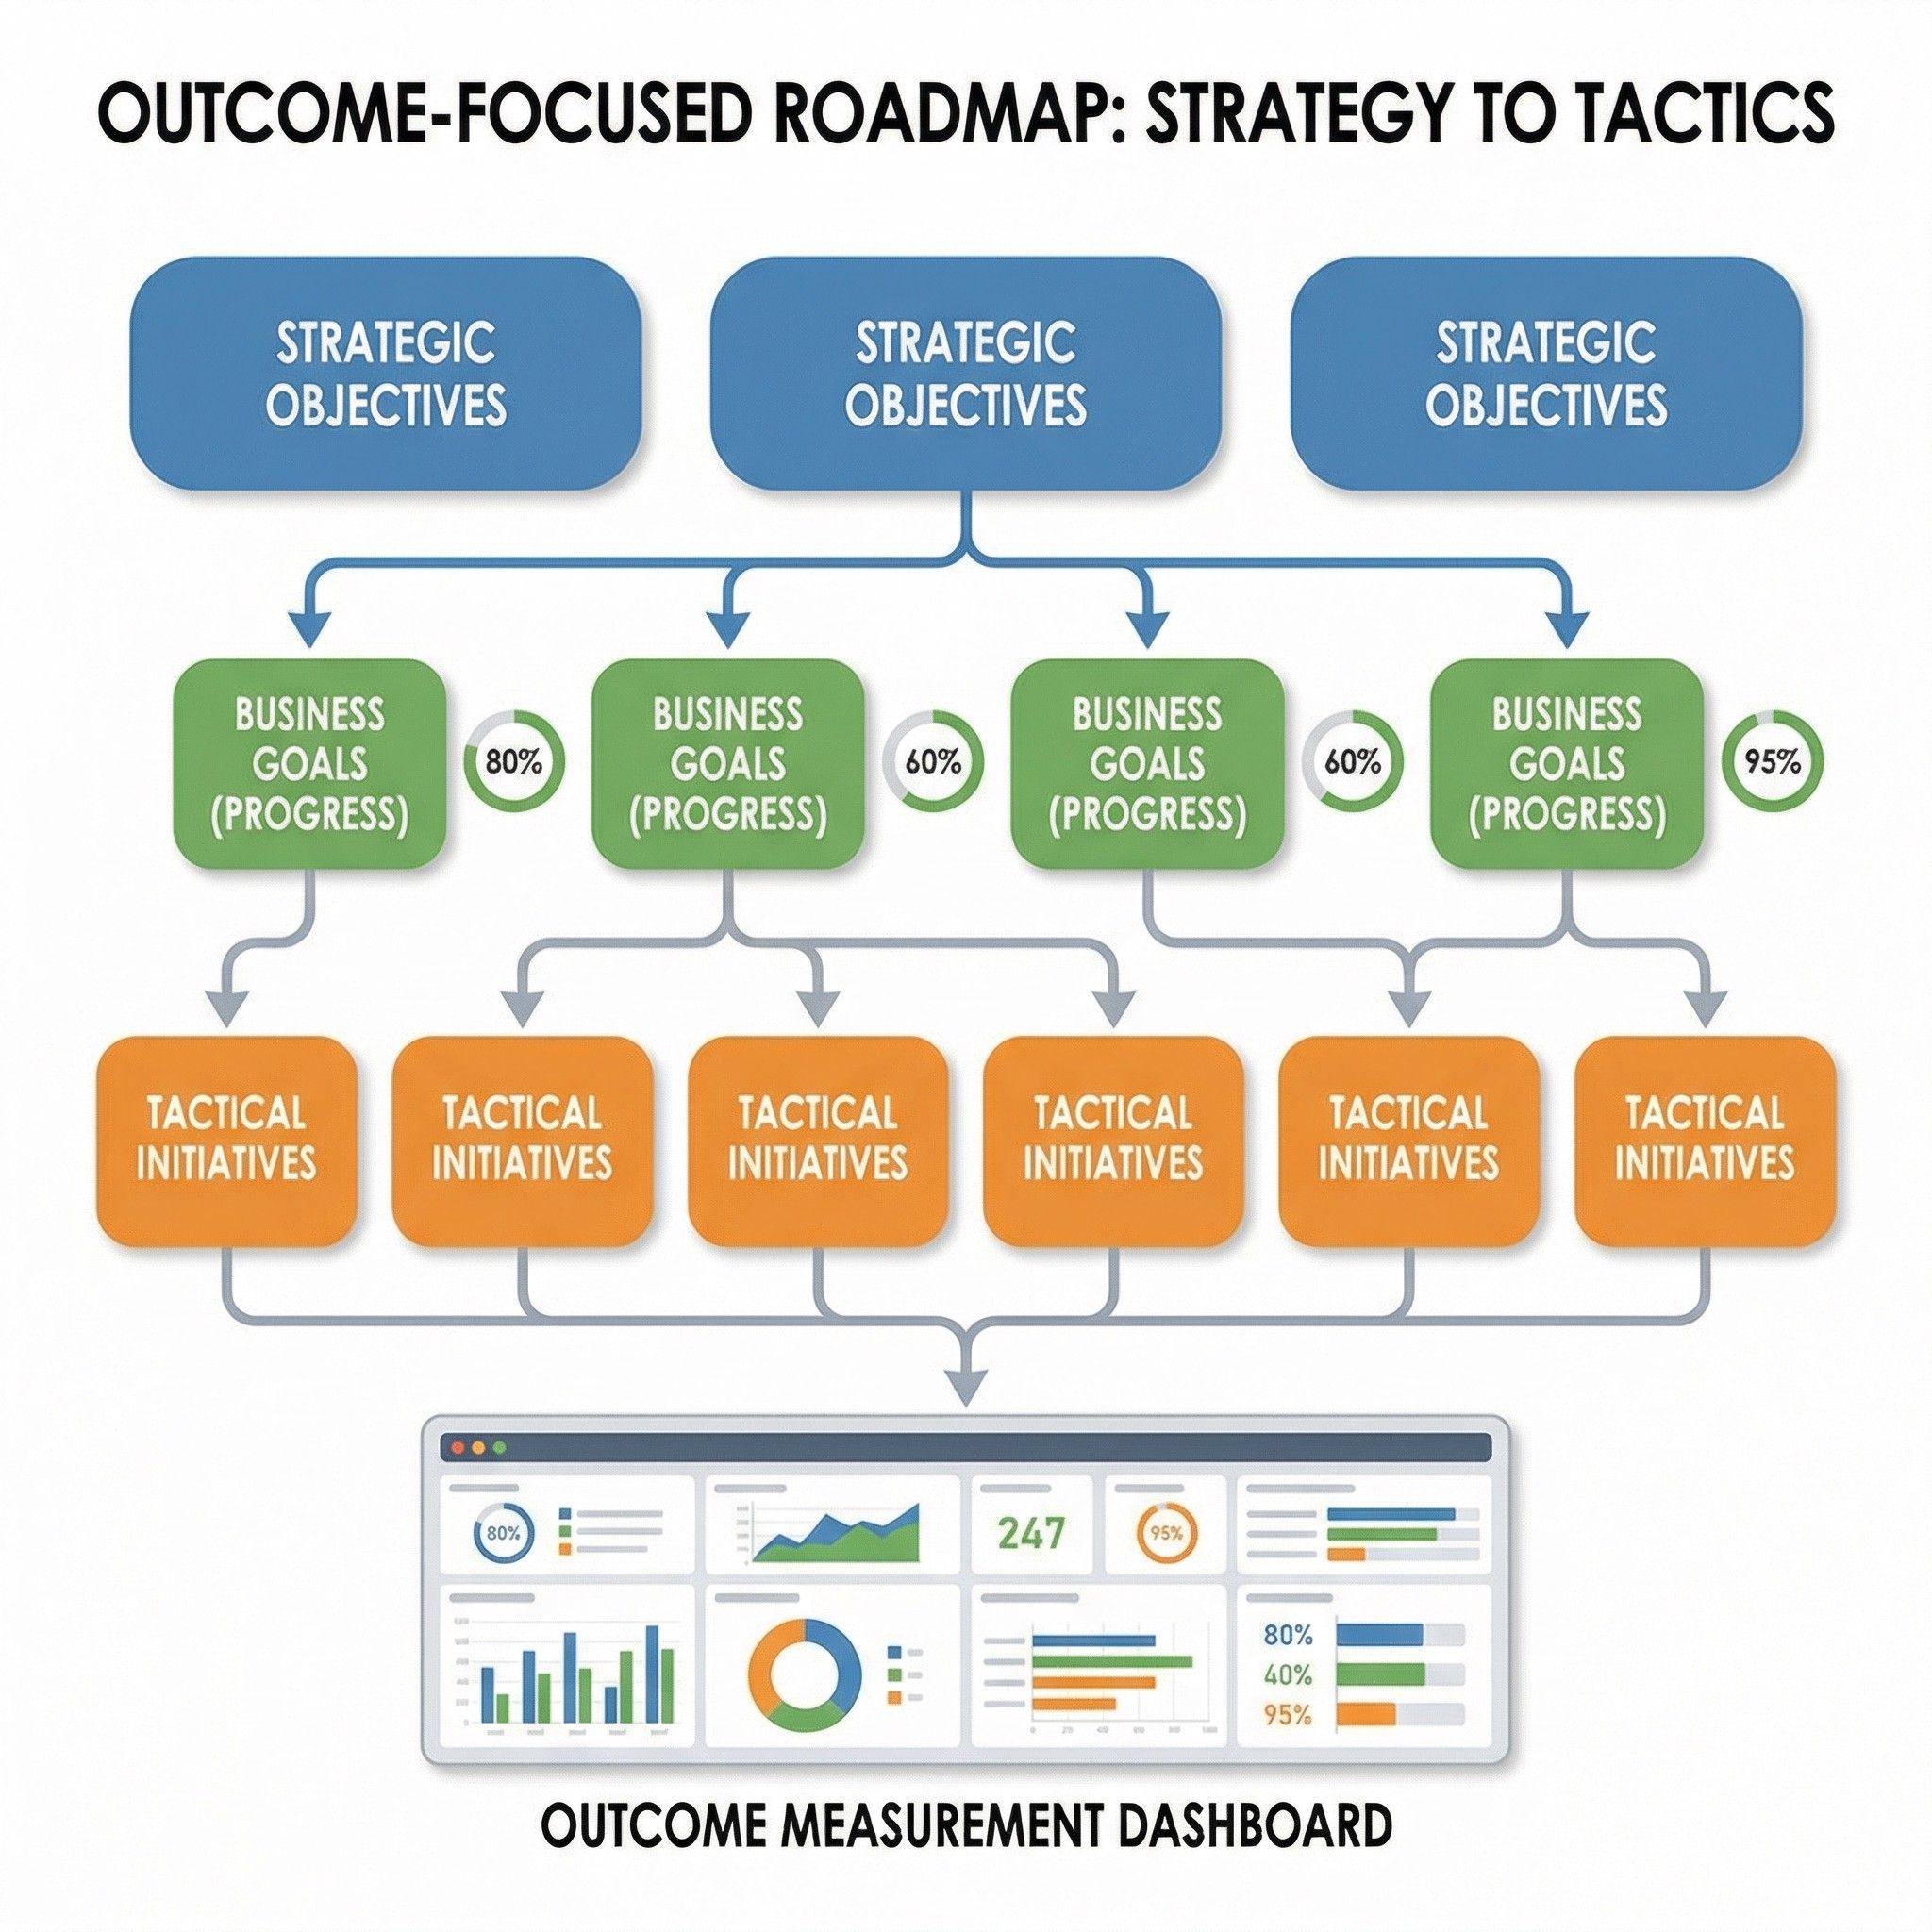
This roadmap prioritizes outcomes over outputs. Every goal is defined by measurable business results, not features shipped. We focus on what success looks like for our customers and business, ensuring every initiative drives meaningful impact.
OKR Framework Alignment
Each strategic goal follows the OKR methodology with clear Objectives and 3-5 Key Results. This creates alignment across teams, enables transparent progress tracking, and ensures accountability at every level of the organization.
Accountability Structure
Every goal has a designated owner at VP+ level with clear responsibility for outcomes. Monthly reviews track progress, quarterly business reviews assess goal health, and executive sponsors ensure resource allocation and obstacle removal.
Success Measurement
We measure success through quantifiable metrics tied to business outcomes: revenue growth, market share, customer retention, and operational efficiency. Each Key Result has specific targets and timelines for achievement.
How to Use This Roadmap
- Start with Goals: Review the 8 strategic goals and understand the business outcomes we're driving toward
- Track Key Results: Monitor progress on specific, measurable KRs that indicate goal achievement
- Connect Initiatives: See how tactical initiatives support strategic goals and contribute to outcomes
- Review Regularly: Use monthly reviews for progress tracking and quarterly reviews for strategic adjustments
- Hold Teams Accountable: Each goal owner is responsible for driving results and reporting progress
OKR Framework Visualization
Goals and Initiatives Matrix
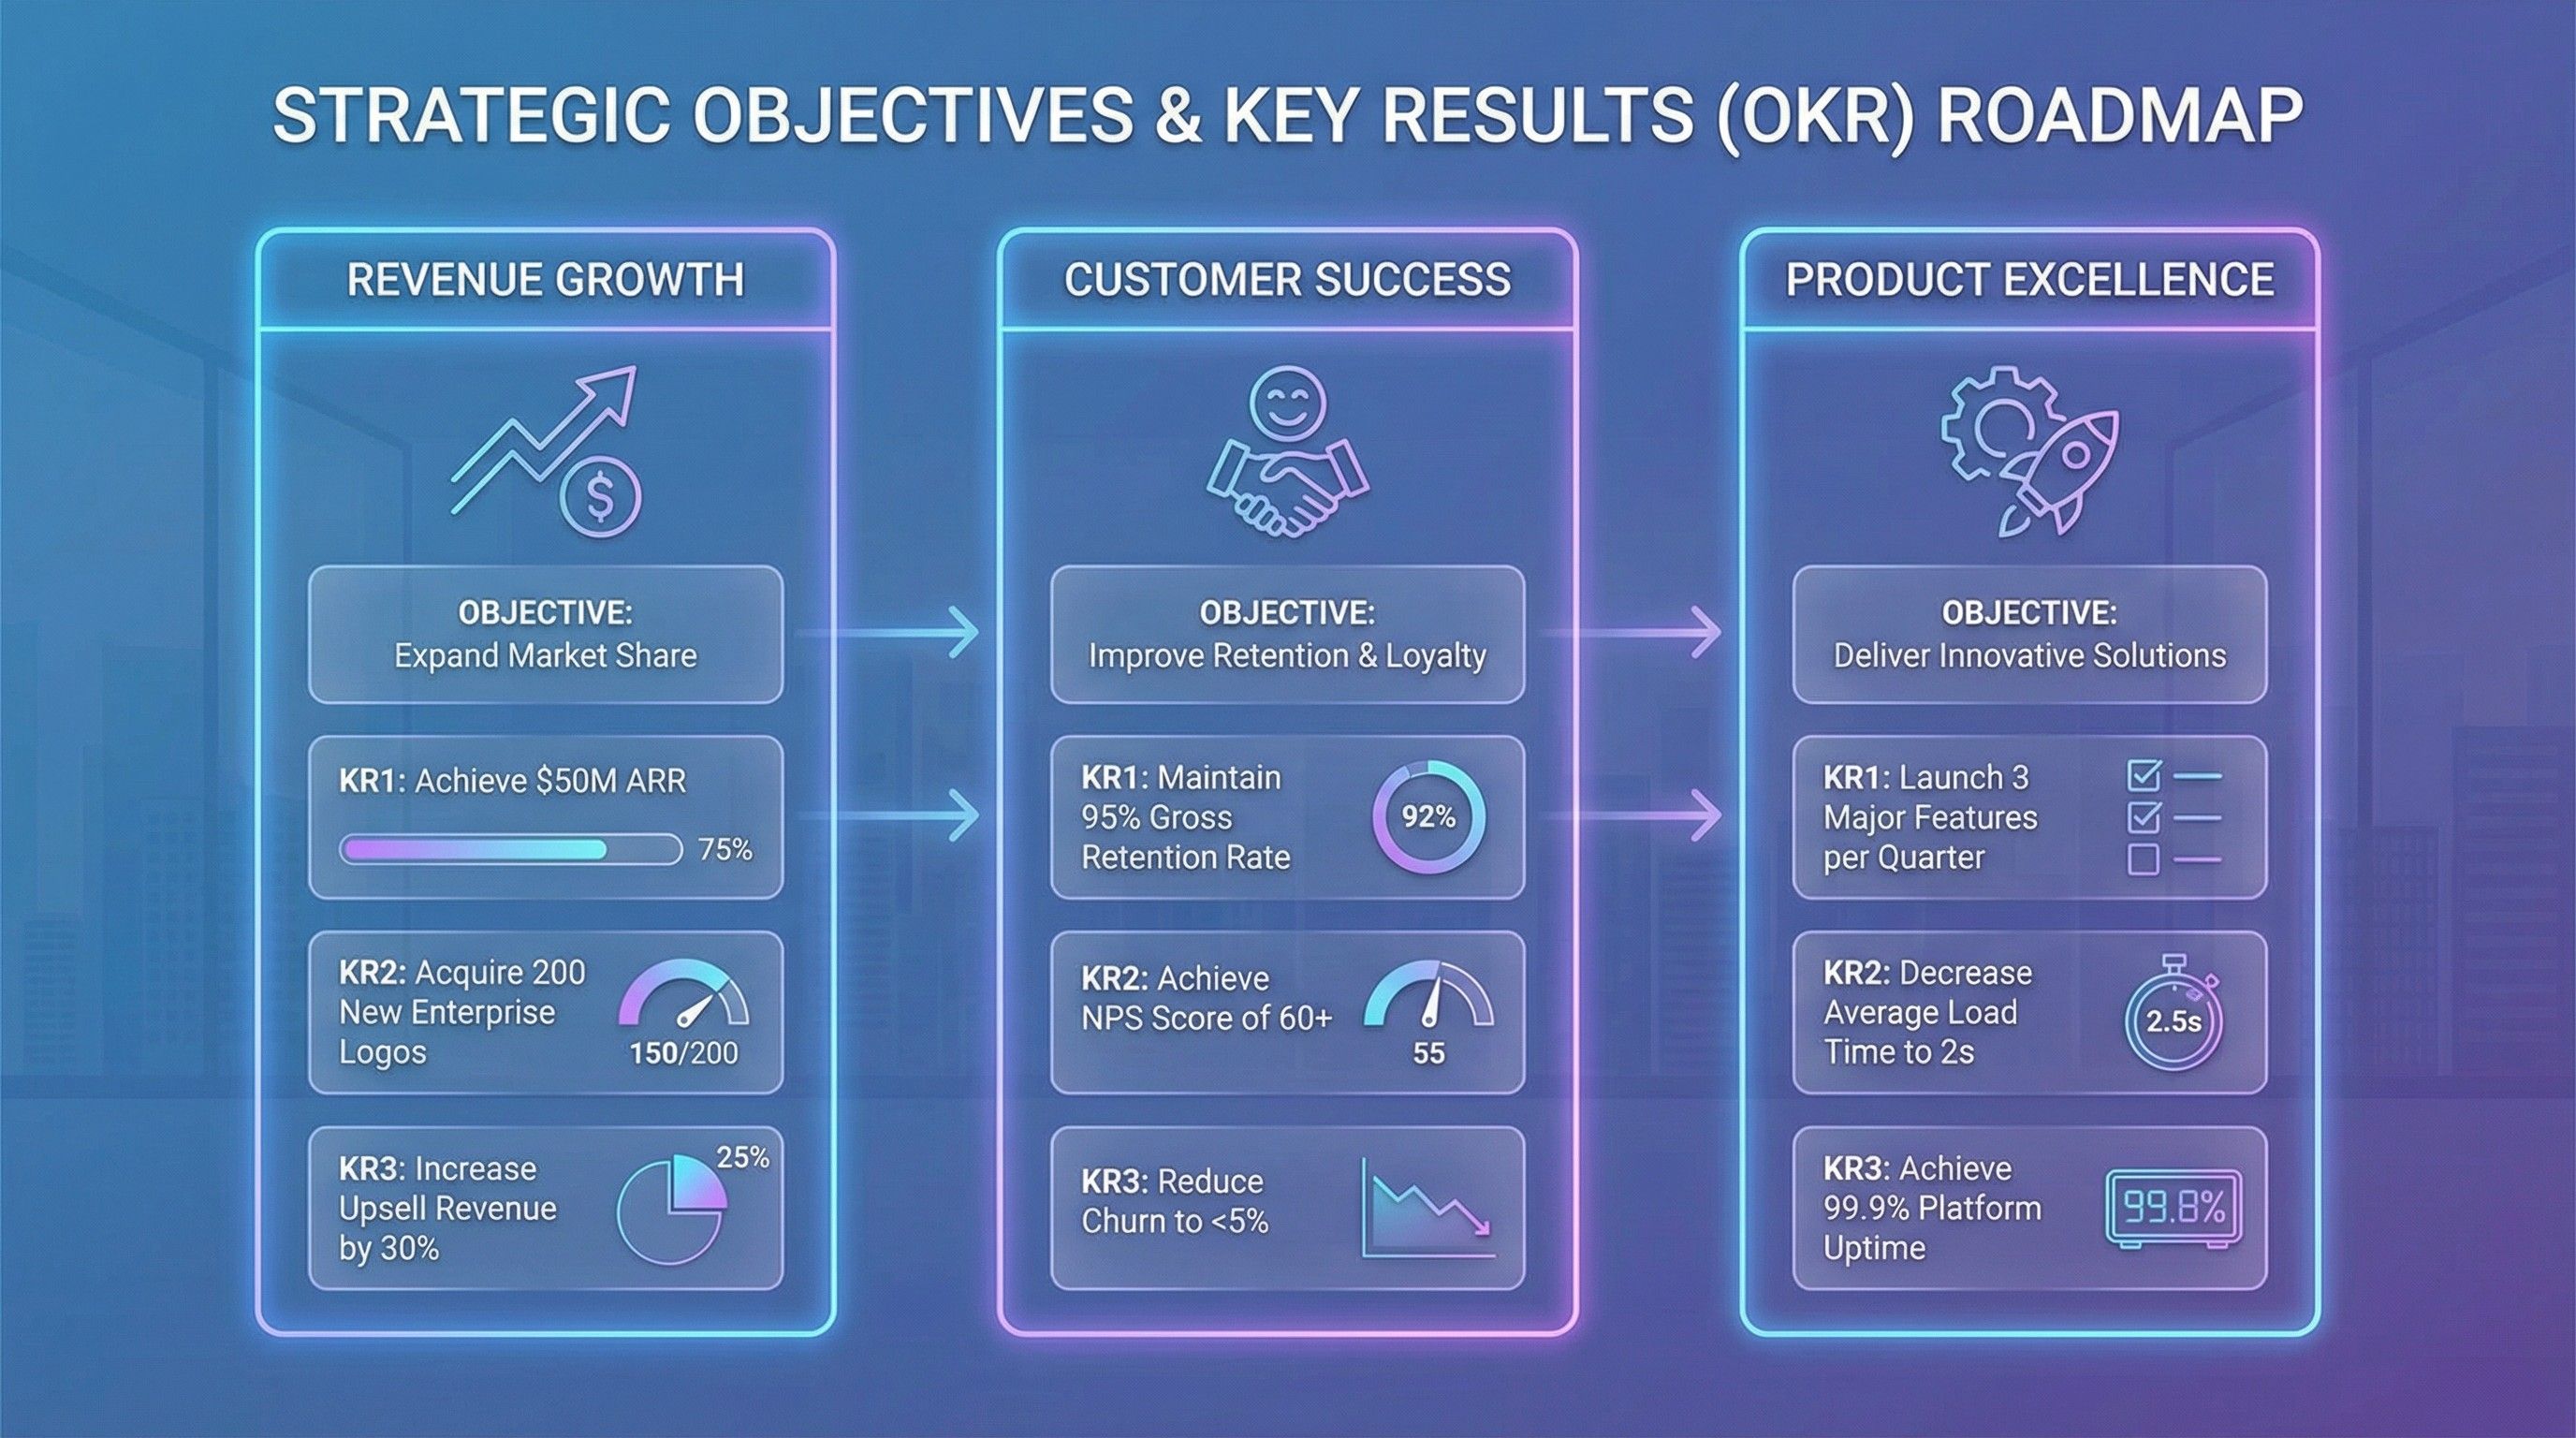
Strategic Goals (2025-2027)
Achieve Market Leadership in Virtual Assistants
Objective
Capture 15% market share in the Virtual Assistant segment by Q4 2026
Why This Matters
- Virtual Assistants represent 25.4% of the market (largest segment)
- Strong NLP advancements creating competitive opportunities
- Early leadership establishes brand authority
Key Results
KR1
Achieve 500,000 active users by Q4 2025
KR2
Reach 85% user satisfaction score by Q2 2026
KR3
Secure 200 enterprise customers by Q4 2026
KR4
Achieve 95% NLP accuracy in top 5 use cases by Q3 2026
KR5
Generate $15M ARR from virtual assistant product by Q4 2026
Success Metrics
Initiatives Supporting This Goal
1. Build Advanced NLP Engine (Q1-Q2 2025)
- Multi-language support for 10+ languages
- Context-aware conversation handling
- Integration with enterprise knowledge bases
2. Launch Virtual Assistant MVP (Q2 2025)
- Core conversational AI capabilities
- CRM integrations (Salesforce, HubSpot)
- Email and calendar management
3. Enhance Dialogue Quality (Q3 2025)
- Sentiment analysis integration
- Personalization engine
- Multi-turn conversation improvements
4. Enterprise Feature Expansion (Q4 2025 - Q2 2026)
- SSO and security compliance
- Custom workflow automation
- Analytics dashboard
5. Scale User Acquisition (Q1-Q4 2026)
- Marketing campaigns targeting IT/Telecom
- Partnership with Google Cloud, ServiceNow
- Referral program launch
Accelerate Cloud Adoption by 300%
Objective
Migrate 60% of customer base to cloud deployment by Q4 2026
Why This Matters
- Cloud is the fastest-growing deployment model
- Reduces infrastructure costs by 40%
- Enables faster feature delivery and scalability
- Current on-premises dominance (60.7%) presents opportunity
Key Results
KR1
Achieve 99.95% uptime SLA by Q2 2025
KR2
Reduce cloud deployment time from 2 weeks to 24 hours by Q3 2025
KR3
Migrate 300 customers from on-prem to cloud by Q4 2026
KR4
Achieve SOC2 Type II and ISO 27001 compliance by Q2 2025
KR5
Reduce customer infrastructure costs by 35% average by Q4 2026
Success Metrics
Initiatives Supporting This Goal
1. Build Multi-Region Cloud Infrastructure (Q1-Q2 2025)
- Deploy in AWS, Azure, GCP
- 5 global regions for low latency
- Auto-scaling capabilities
2. Achieve Security Certifications (Q1-Q2 2025)
- SOC2 Type II compliance
- ISO 27001 certification
- GDPR readiness
3. Launch Migration Tools (Q2-Q3 2025)
- Automated migration wizard
- Zero-downtime migration process
- Data integrity validation
4. Cloud-Native Feature Development (Q3 2025 - Q4 2026)
- Real-time collaboration features
- Elastic compute resources
- Global data synchronization
5. Customer Migration Program (Q1-Q4 2026)
- Dedicated migration support team
- Financial incentives for early adopters
- Training and onboarding programs
Dominate BFSI Vertical Market
Objective
Become the #1 AI productivity platform for financial services by Q4 2027
Why This Matters
- BFSI is the fastest-growing vertical segment
- High-value customers with significant budgets
- Regulatory compliance creates competitive moat
- Strong demand for automation and analytics
Key Results
KR1
Acquire 100 BFSI customers by Q4 2026
KR2
Achieve 40% market share in BFSI segment by Q4 2027
KR3
Generate $25M ARR from BFSI customers by Q4 2027
KR4
Achieve 90% customer retention in BFSI by Q4 2026
KR5
Secure regulatory approvals in 5 key markets by Q2 2027
Success Metrics
Initiatives Supporting This Goal
1. Build BFSI Compliance Framework (Q3-Q4 2025)
- PCI-DSS compliance
- Financial data encryption
- Audit trail capabilities
2. Develop Financial Use Cases (Q4 2025 - Q1 2026)
- Risk assessment automation
- Fraud detection AI
- Customer service chatbots for banking
3. Launch BFSI-Specific Product (Q2 2026)
- Regulatory reporting automation
- Compliance monitoring dashboard
- Financial document processing
4. Build Industry Partnerships (Q2-Q4 2026)
- Partner with banking platforms
- Integrate with core banking systems
- Financial data providers integration
5. Scale BFSI Sales Team (Q1-Q4 2027)
- Hire industry specialists
- Targeted marketing campaigns
- Industry conference presence
Maximize Data Analytics Revenue Growth
Objective
Grow data analytics revenue by 400% year-over-year
Why This Matters
- Data Analytics is the fastest-growing offering segment
- Predictive analytics provides competitive differentiation
- High-margin product with strong customer demand
- Enables upsell opportunities across customer base
Key Results
KR1
Launch predictive analytics platform by Q2 2025
KR2
Achieve 10M API calls per month by Q4 2025
KR3
Reach $20M ARR from analytics products by Q4 2026
KR4
Achieve 90% prediction accuracy across top 10 models by Q3 2026
KR5
Acquire 500 analytics customers by Q4 2026
Success Metrics
Initiatives Supporting This Goal
1. Build Predictive Analytics Engine (Q1-Q2 2025)
- Machine learning model library
- AutoML capabilities
- Real-time data processing
2. Launch Analytics Platform Beta (Q2 2025)
- Dashboard builder
- Custom report generation
- Data connector marketplace
3. Develop Industry-Specific Models (Q3 2025 - Q1 2026)
- Sales forecasting models
- Customer churn prediction
- Resource optimization algorithms
4. Integrate with BI Tools (Q2-Q3 2026)
- Tableau integration
- Power BI connector
- Looker partnership
5. Launch Analytics Marketplace (Q4 2026)
- Pre-built analytics templates
- Third-party model integration
- Revenue sharing program
Establish Multi-Agent Ecosystem Leadership
Objective
Create the industry's most comprehensive multi-agent AI platform by Q4 2027
Why This Matters
- Multi-agent ecosystems are emerging as critical enterprise need
- First-mover advantage in interoperability standards
- High strategic value for enterprise customers
- Aligns with Deloitte/Google Cloud market trends
Key Results
KR1
Launch agent orchestration platform by Q1 2026
KR2
Achieve 100+ agent integrations by Q4 2026
KR3
Onboard 50 enterprise customers to multi-agent platform by Q2 2027
KR4
Process 1M automated workflows per month by Q4 2027
KR5
Establish industry interoperability standard adopted by 5+ vendors by Q4 2027
Success Metrics
Initiatives Supporting This Goal
1. Build Agent Orchestration Framework (Q3-Q4 2025)
- Agent communication protocol
- Workflow automation engine
- Cross-platform integration layer
2. Launch Developer Platform (Q1 2026)
- Agent SDK and APIs
- Developer documentation
- Sandbox environment
3. Create Pre-Built Agent Library (Q2-Q3 2026)
- 50+ ready-to-deploy agents
- Industry-specific agents
- Customization toolkit
4. Establish Interoperability Protocol (Q3-Q4 2026)
- Open standard definition
- Partner collaboration program
- Industry working group
5. Scale Agent Marketplace (Q1-Q4 2027)
- Third-party agent submissions
- Quality certification program
- Revenue sharing model
Expand Global Market Presence
Objective
Achieve 25% revenue from Asia Pacific and Europe by Q4 2027
Why This Matters
- Asia Pacific is the fastest-growing region
- Geographic diversification reduces risk
- Access to new customer segments
- Current North America concentration (31.7%) presents opportunity
Key Results
KR1
Launch in 3 APAC markets by Q4 2025
KR2
Acquire 200 APAC customers by Q4 2026
KR3
Launch in 5 European markets by Q2 2027
KR4
Achieve $15M ARR from international markets by Q4 2027
KR5
Establish local partnerships in 8 countries by Q4 2027
Success Metrics
Initiatives Supporting This Goal
1. Asia Pacific Market Entry (Q3-Q4 2025)
- Regional data centers (Singapore, Tokyo, Sydney)
- Local language support (Mandarin, Japanese, Korean)
- Regional partnerships
2. Build International Sales Teams (Q4 2025 - Q2 2026)
- Hire regional sales leaders
- Establish local offices
- Cultural adaptation training
3. Regulatory Compliance Program (Q1-Q3 2026)
- GDPR compliance for Europe
- Local data residency requirements
- Regional security certifications
4. Europe Market Launch (Q2-Q3 2027)
- EU data centers
- Multi-language support (German, French, Spanish)
- European partnerships
5. Global Marketing Campaigns (Q3-Q4 2027)
- Regional brand building
- Industry event presence
- Local customer success stories
Improve Customer Retention and Expansion
Objective
Achieve 95% gross retention and 130% net retention by Q4 2026
Why This Matters
- Retention is more cost-effective than acquisition
- High retention indicates product-market fit
- Net retention drives sustainable growth
- Customer success is competitive differentiator
Key Results
KR1
Reduce churn in first 90 days from 15% to 5% by Q4 2025
KR2
Achieve 95% gross retention rate by Q4 2026
KR3
Reach 130% net retention rate by Q4 2026
KR4
Increase product adoption from 40% to 75% by Q3 2026
KR5
Achieve NPS score of 70+ by Q4 2026
Success Metrics
Initiatives Supporting This Goal
1. Redesign Onboarding Experience (Q1-Q2 2025)
- Interactive product tours
- Time-to-value optimization
- Success milestone tracking
2. Launch Customer Success Platform (Q2-Q3 2025)
- Health score monitoring
- Proactive intervention alerts
- Usage analytics dashboard
3. Build Expansion Playbook (Q3 2025)
- Upsell trigger identification
- Cross-sell opportunity mapping
- Customer success manager training
4. Improve Product Adoption (Q4 2025 - Q2 2026)
- In-app guidance and tips
- Feature discovery campaigns
- Usage-based recommendations
5. Create Customer Community (Q1-Q4 2026)
- User forum and knowledge base
- Customer advisory board
- Peer learning programs
Accelerate Time-to-Market and Innovation
Objective
Reduce product development cycle time by 50% while increasing innovation velocity
Why This Matters
- Fast-moving market requires rapid iteration
- Competitive advantage through speed
- Customer expectations for continuous improvement
- Engineering efficiency drives profitability
Key Results
KR1
Reduce average feature development time from 12 weeks to 6 weeks by Q2 2026
KR2
Launch 24 major features per year (vs. current 12) by Q4 2026
KR3
Achieve 95% deployment success rate by Q3 2025
KR4
Reduce bug escape rate by 60% by Q4 2026
KR5
Increase engineering productivity by 40% by Q4 2026
Success Metrics
Initiatives Supporting This Goal
1. Implement Continuous Deployment (Q1-Q2 2025)
- Automated testing pipeline
- Feature flag system
- Canary deployment process
2. Adopt AI-Assisted Development (Q2-Q3 2025)
- GitHub Copilot integration
- Automated code review
- AI-powered testing
3. Build Design System (Q3 2025)
- Component library
- Design tokens
- Reusable patterns
4. Launch Innovation Labs (Q4 2025)
- 20% time for experimentation
- Rapid prototyping framework
- Customer co-creation program
5. Optimize Engineering Processes (Q1-Q4 2026)
- Agile methodology refinement
- Technical debt reduction
- Knowledge sharing platform
Success Dashboard
Overall Health
Goals Achieved
On Track
At Risk
Key Results Progress
Revenue Impact
Quarterly Progress Tracker
| Goal | Q1 2025 | Q2 2025 | Q3 2025 | Q4 2025 | Status |
|---|---|---|---|---|---|
| Virtual Assistant Leadership | ✅ NLP Engine Built | ✅ MVP Launched | 🔄 Quality Enhancement | 📅 Enterprise Features | ● On Track |
| Cloud Adoption | ✅ Infrastructure Ready | ✅ SOC2 Certified | 🔄 Migration Tools | 📅 Customer Migration | ● On Track |
| BFSI Vertical | 📅 Planning | 📅 Planning | 🔄 Compliance Framework | 📅 Use Case Development | ● At Risk |
| Data Analytics Growth | ✅ Engine Built | 🔄 Platform Beta | 📅 Industry Models | 📅 BI Integration | ● On Track |
| Multi-Agent Ecosystem | 📅 Planning | 📅 Planning | 🔄 Framework Build | 📅 Developer Platform | ● On Track |
| Global Expansion | 📅 Planning | 📅 Planning | 🔄 APAC Entry | 📅 Sales Teams | ● On Track |
| Customer Retention | ✅ Onboarding Redesign | 🔄 Success Platform | 📅 Expansion Playbook | 📅 Adoption Improvement | ● On Track |
| Innovation Velocity | ✅ CI/CD Implemented | 🔄 AI Development | 📅 Design System | 📅 Innovation Labs | ● On Track |
Accountability Framework
Review Cadence
Monthly: Goal owner reviews with direct reports
Quarterly: Business reviews with executive team
Annual: Strategic planning and goal setting
Decision-Making Process
Goal owners have autonomy for tactical decisions. Strategic pivots require executive approval. Cross-functional dependencies escalated to CTO/CRO level.
Escalation Procedures
Blockers escalated within 48 hours. At-risk goals reviewed weekly. Executive intervention for high-impact issues. Board updates quarterly.
Performance Metrics
Goal achievement tied to compensation. Quarterly bonuses based on KR progress. Annual reviews include roadmap impact assessment.
Goal Owners & Executive Sponsors
| Goal | Owner | Executive Sponsor | Review Frequency | Key Stakeholders |
|---|---|---|---|---|
| Virtual Assistant Leadership | VP of Product - Virtual Assistant | Chief Product Officer | Bi-weekly | Engineering, Marketing, Sales |
| Cloud Adoption | VP of Engineering - Infrastructure | Chief Technology Officer | Weekly | Security, DevOps, Customer Success |
| BFSI Vertical | VP of Vertical Solutions - BFSI | Chief Revenue Officer | Monthly | Compliance, Sales, Product |
| Data Analytics Growth | VP of Product - Data Analytics | Chief Product Officer | Bi-weekly | Data Science, Engineering, Marketing |
| Multi-Agent Ecosystem | Chief Technology Officer | CEO | Monthly | Platform Engineering, Partnerships |
| Global Expansion | Chief Revenue Officer | CEO | Monthly | International Ops, Legal, Marketing |
| Customer Retention | VP of Customer Success | Chief Revenue Officer | Bi-weekly | Product, Support, Data Analytics |
| Innovation Velocity | VP of Engineering | Chief Technology Officer | Weekly | DevOps, QA, Product Design |
Risk Management
Risk Assessment Process
Monthly risk reviews for all goals. Probability and impact scoring (1-5 scale). Risk register maintained by PMO. Mitigation plans required for high-risk items.
Mitigation Strategies
Proactive risk identification in planning. Buffer allocation for high-risk initiatives. Cross-functional risk workshops. Contingency planning for critical paths.
Contingency Plans
Alternative approaches documented for each goal. Resource reallocation protocols. Scope adjustment procedures. Timeline extension thresholds.
Risk Monitoring
Real-time risk tracking dashboard. Weekly risk status updates. Escalation triggers defined. Post-mortem analysis for realized risks.
Goal-Level Risk Assessment
| Goal | Risk Level | Primary Risks | Mitigation Strategy | Contingency Plan |
|---|---|---|---|---|
| Virtual Assistant Leadership | Medium | NLP accuracy targets, competitive pressure | Invest in research team, continuous model improvement | Focus on niche use cases if broad accuracy not achieved |
| Cloud Adoption | High | Migration complexity, customer resistance, downtime | Phased migration, dedicated support, financial incentives | Maintain hybrid deployment option, extend timeline |
| BFSI Vertical | High | Regulatory compliance delays, long sales cycles | Early compliance investment, industry partnerships | Target adjacent verticals (healthcare, legal) |
| Data Analytics Growth | Medium | Model accuracy, competitive BI tools integration | Focus on differentiated use cases, strong partnerships | Pivot to embedded analytics if standalone adoption slow |
| Multi-Agent Ecosystem | High | Market readiness, standard adoption, technical complexity | Early customer co-creation, phased rollout | Focus on internal agent orchestration first |
| Global Expansion | High | Regulatory barriers, cultural adaptation, competition | Local partnerships, regional expertise hiring | Prioritize highest-potential markets, delay others |
| Customer Retention | Medium | Product gaps, competitive switching, support capacity | Continuous product improvement, proactive support | Increase customer success team, feature prioritization |
| Innovation Velocity | Medium | Technical debt, quality issues, team burnout | Balanced velocity/quality metrics, sustainable pace | Adjust velocity targets, focus on highest-impact features |
Critical Risk Alert
BFSI Vertical Goal is currently at risk due to regulatory compliance timeline delays. Mitigation actions in progress:
- Accelerated compliance team hiring (2 additional specialists)
- Engaged external regulatory consultants in 3 key markets
- Adjusted timeline for regulatory approvals from Q4 2026 to Q2 2027
- Exploring partnership with established BFSI platform for faster entry